The mean number of adenomas per colonoscopy significantly correlates with the adenoma detection rate, but not with the polyp detection rate, in both screening and all colonoscopies
Ivana Mikoviny Kajzrlíková Orcid.org 1, Petr Vítek2,3, Josef Chalupa Orcid.org 4, Jan Kuchař Orcid.org 5, Jiří Platoš Orcid.org 5, Pavel Řeha Orcid.org 5, Pavel Klvaňa Jr6
+ Affiliation
Summary
Background and aim: The adenoma detection rate (ADR) is generally accepted to be a quality indicator. The mean number of adenomas per colonoscopy (MAP) is considered to be the most objective quality indicator. This study aimed to assess if ADR or the polyp detection rate (PDR) better reflects the quality of colonoscopy with regard to MAP. Methods: Quality indicators of all colonoscopies performed at Hospital Frydek-Mistek from January 2013 to December 2017 were retrospectively assessed. ADR, PDR, and MAP were calculated for all colonoscopies performed in patients older than 50 years, excluding those that were performed for therapeutic purposes, examination of inflammatory bowel disease patients, and management of complications and sigmoidoscopies (screening, surveillance, and diagnostic), as well as specifically for screening colonoscopies. Correlations between MAP and ADR/PDR were assessed by calculating Pearson’s correlation coefficients p < 0.05 was considered significant. Results: A total of 6,925 patients (3,620 men and 3,305 women) with a mean age of 66.2 years were included. There was a positive correlation between MAP and ADR in all colonoscopies (p < 0.005) and screening colonoscopies (p = 0.009), but not between MAP and PDR (p = 0.055 and p = 0.176). Conclusion: There was a significant positive correlation between MAP and ADR, but not between MAP and PDR, in all and screening colonoscopies. Considering that MAP is the most objective quality indicator, the quality of colonoscopy is better reflected by ADR than by PDR.
Keywords
colonoscopy, colonic neoplasms, mass screeningIntroduction
Colonoscopy with polypectomy has been associated with a reduction in the incidence of colorectal cancer (CRC) as well as mortality secondary to CRC [1,2]. In order to minimise variations in physicians’ performance and the resulting risk of interval CRC after a colonoscopy, several quality indicators were established.
Adenoma detection rate (ADR) is defined as the proportion of patients with one or more adenomas removed during a screening colonoscopy in patients 50 years of age or older and it is a generally accepted quality indicator [3]. ADR reflects adequate inspection of the bowel mucosa and it has been inversely associated with the risk of interval CRC and CRC death [4,5]. Corley et al have presented a 3% reduction in CRC incidence and a 5% reduction in CRC mortality for each 1% increase of ADR [6]. The minimum target for overall ADR is at least 25% (30% for men, 20% for women) [7].
For possible gaming with ADR other indicators are being discussed. One possible way of gaming with ADR is by changing the colonoscopy indication. The endoscopist can present the examination as a screening examination if an adenoma has been detected and as a diagnostic examination using the patient’s symptoms if no adenoma has been detected. This can be solved by calculating the overall ADR instead of the screening ADR [8]. Another method of possible gaming is the ‘one and done’ strategy. Because only one adenoma is needed to score, after removal of the first adenoma, the remaining colon can be examined less carefully [9].
Polyp detection rate (PDR) is defined as the proportion of patients with one or more polyps removed during a screening colonoscopy in patients 50 years of age or older. Calculating PDR does not require histopathology data, thus it can be useful in a resect and discard strategy and it correlates well with the ADR [10,11]. With an average adenoma-to-polyp detection ratio of 0.64 the minimum standard PDR was estimated at 40%, which corresponds to an ADR of 25% [12]. On the other hand, calculating the PDR can lead to the removal of clinically insignificant lesions, for example distal colon diminutive hyperplastic polyps.
Mean adenoma per colonoscopy (MAP) or Adenoma per colonoscopy (APC) calculates all adenomas found and removed during the procedure and reflects the quality of the examination of the entire length of the colon. It is considered to be the most objective quality indicator. However, MAP was proven not to be superior to ADR in a study by Kaminsky et al. [13]. To date no benchmark has been established. In a study by Denis et al; they suggested that a benchmark could be established at 0.6 in the French programme [9].
The aim of our study was to compare MAP with the ADR and PDR of all colonoscopists in our department, both for all colonoscopies and screening colonoscopies and to assess if the ADR or PDR better reflects the quality of the colonoscopy with regard to MAP.
Materials and methods
We retrospectively assessed the quality indicators of all colonoscopies performed in Beskydy Gastrocentre, Frydek-Mistek Hospital from January 2013 to December 2017. The data from all colonoscopies performed in this period were recorded in our database. The database contains epidemiological data about the patient (age, gender, antiplatelet and anticoagulation therapy, family history of CRC), data about the examination (type of examination, indication, sedation, bowel preparation, caecal intubation, number of lesions), histological results and complications.
The colonoscopies were performed by six experienced endoscopists-gastroenterologists. All examinations were performed using high-definition colonoscopes.
The study was approved by the local institutional review board. The local institutional review board granted exemption from informed consent as the patients were receiving the standard of care, the data collection did not influence medical practice and the data were deidentified before analysis. All the patients signed an informed consent with the colonoscopy. The study was registered on ClinicalTrials.gov (NCT03723720).
The data on patients over 50 years of age scheduled for a colonoscopy between January 2013 and December 2017 were included. The study indications were grouped into the following categories: screening, surveillance and diagnostic. Therapeutic examinations, procedures in patients with inflammatory bowel disease (IBD) and procedures performed due to management of complications and sigmoidoscopies were excluded from the study.
We calculated the ADR, PDR and MAP for all colonoscopies in patients over 50 years of age (screening, surveillance, diagnostic) and separately only for screening colonoscopies. Continuous variables were expressed as the mean ± standard deviation (SD) and categorical data were displayed as number (n) and percentage (%). Correlations between ADR/PDR, MAP/ADR and MAP/PDR were performed using Pearson’s correlation coefficient. The multiple chi square test was used to compare the patients’ age and one way ANOVA was used to compare the proportions of men and women among the endoscopists. P < 0.05 was considered significant. Statistical analysis was performed using SPSS (version 19.0).
Results
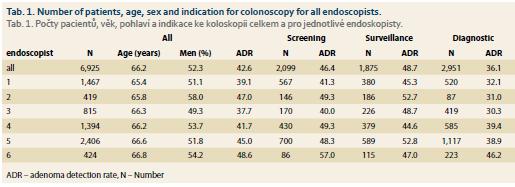
In the study period, 10,472 colonoscopies and sigmoidoscopies were done in total. Sigmoidoscopies and colonoscopies from indication therapeutic, IBD and management of complications were excluded from the study. The group for statistics comprised 6,925 patients (3,620 men, 3,305 women, mean age 66.2 years, SD ± 9.2 years) who underwent screening (2,099 patients), surveillance (1,875 patients) or diagnostic colonoscopy (2,951 patients).
Among six endoscopists, there were differences in the proportion of men and women (p = 0.048) and the age of the patients (p = 0.002) (tab. 1). This should be taken into consideration when comparing various endoscopists, but it does not affect the correlation analysis of ADR, PDR and MAP.
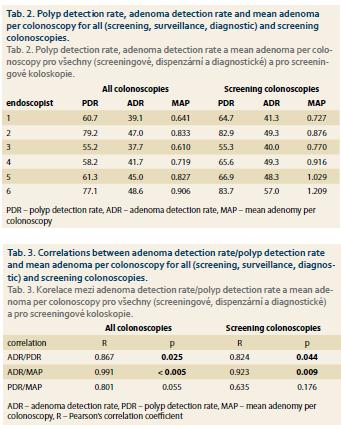
In correlation analysis, there were positive correlations between ADR and PDR, both for all colonoscopies and for screening colonoscopies (p = 0.025, p = 0.044). There were positive correlations between MAP and ADR for all colonoscopies and screening colonoscopies (p < 0.005, p = 0.009) but not for MAP and PDR (p = 0.055, p = 0.176) (tab. 2 and 3).
Discussion
The quality of the colonoscopic examination is now considered to be one of the most important parts of all CRC screening programs. It has been proved that a lower quality of exam can result in interval colon cancers and that this trend can be prevented by appropriate training of endoscopists with a low ADR [5]. Various quality indicators of colonoscopic examinations were established in the current guidelines from 2017, pre-procedure, related to the procedure and post-procedure. Key performance measures include rate of adequate bowel preparation ≥ 90%, caecal intubation rate ≥ 90%, ADR ≥ 25%, appropriate polypectomy technique ≥ 80%, complication rate, patient experience and appropriate post-polypectomy surveillance [4].
To date there are several quality indicators used for the detection of adenomas or polyps. ADR is the gold standard but has several limitations and there is space for possible gaming. The ADR for all endoscopists in our study was 46% for screening and 42% for all colonoscopies, which exceeds current quality standards.
Other indicators are PDR and MAP (also called APC). Calculating the PDR can also be accompanied with possible gaming. MAP seems to be the most objective quality indicator because it reflects the quality of examination of the entire length of the colon. No benchmark for MAP has been established to date. In our study, all endoscopists reached MAP over 0.6. The MAP range among our endoscopists was 0.610–0.906 for all colonoscopies and 0.727–1.209 for screening colonoscopies.
The correlation between ADR and PDR was well proven in several studies, as well as in our study, both for all colonoscopies (p = 0.025) and screening colonoscopies (p = 0.044) [10,14,15]. However, in others the correlation was poor for polyps in the distal colorectum, thus caution should be exercised when using PDR as a surrogate for ADR if data from the rectum and sigmoid are included [4,16,17].
Considering MAP to be the most objective quality indicator, the aim of our study was to compare MAP with the ADR and PDR of all colonoscopists in our department, both for all colonoscopies and screening colonoscopies and to assess if the ADR or PDR better reflects the quality of the colonoscopy with regard to MAP.
In our study there were positive correlations between MAP and ADR for all colonoscopies (p < 0.005) and screening colonoscopies (p = 0.009) but not for MAP and PDR, also both for all colonoscopies (p = 0.055) and screening colonoscopies (p = 0.176). This shows that ADR better reflects the quality of the colonoscopic examination and the PDR should not replace calculating the ADR at the moment.
The limitations of this study include the fact that it was performed at a single centre. All six endoscopists had overall ADRs and screening ADRs above 35% (screening ADRs above 40%). Thus, the results may not be transferred to the centres with lower ADRs.
In summary, in our study there were significant positive correlations between MAP and ADR but not between MAP and PDR both for all colonoscopies and screening colonoscopies. Considering MAP to be the most objective quality indicator, we assume that the quality of the colonoscopy is better reflected by the ADR than the PDR.
Submitted/Doručeno: 28. 4. 2019
Accepted/Přijato: 20. 5. 2019
Ivana Mikoviny Kajzrliková MD, PhD
Beskyd gastroenterology center, Internal medicine, Hospital Frýdek-Místek
El. Krásnohorské 321, Frýdek
738 01 Frýdek-Místek
kajzrlikova@nemfm.cz
To read this article in full, please register for free on this website.
Benefits for subscribers
Benefits for logged users
Literature
1. Winawer SJ, Zauber AG, Ho MN et al. Prevention of colorectal cancer by colonoscopic polypectomy. The National Polyp Study Workgroup. N Engl J Med 1993; 329 (27): 1977–1981. doi: 10.1056/NEJM199312303292 701.
2. Nishihara R, Wu K, Lochhead P et al. Long-term colorectal-cancer incidence and mortality after lower endoscopy. N Engl J Med 2013; 369 (12): 1095–1105. doi: 10.1056/NEJMoa1301 969.
3. Rex DK, Petrini JL, Baron TH et al. Quality indicators for colonoscopy. Gastrointest Endosc 2006; 63 (Suppl 4): S16–S28. doi: 10.1016/j.gie.2006.02.021.
4. Kaminski MF, Thomas-Gibson S, Bugajski M et al. Performance measures for lower gastrointestinal endoscopy: a European Society of Gastrointestinal Endoscopy (ESGE) Quality Improvement Initiative. Endoscopy 2017; 49 (4): 378–397. doi: 10.1055/s-0043-103411.
5. Kaminski MF, Regula J, Kraszewska E et al. Quality indicators for colonoscopy and the risk of interval cancer. N Engl J Med 2010; 362 (19): 1795–1803. doi: 10.1056/NEJMoa0907 667.
6. Corley DA, Jensen CD, Marks AR et al. Adenoma detection rate and risk of colorectal cancer and death. N Engl J Med 2014; 370 (14): 1298–1306. doi: 10.1056/NEJMoa1309086.
7. Rex DK, Schoenfeld PS, Cohen J et al. Quality indicators for colonoscopy. Gastrointest Endosc 2015; 81 (1): 31–53. doi: 10.1016/j.gie.2014.07.058.
8. Rex DK, Ponugoti PL. Calculating the adenoma detection rate in screening colonoscopies only: is it necessary? Can it be gamed? Endoscopy 2017; 49 (11): 1069–1074. doi: 10.1055/s-0043-113445.
9. Denis B, Sauleau EA, Gendre I et al. The mean number of adenomas per procedure should become the gold standard to measure the neoplasia yield of colonoscopy: a population-based cohort study. Dig Liver Dis 2014; 46 (2): 176–181. doi: 10.1016/j.dld.2013.08.129.
10. Williams JE, Holub JL, Faigel DO. Polypectomy rate is a valid quality measure for colonoscopy: results from a national endoscopy database. Gastrointest Endosc 2012; 75 (3): 576–582. doi: 10.1016/j.gie.2011.12.012.
11. Kessler WR, Imperiale TF, Klein RW et al. A quantitative assessment of the risks and cost savings of forgoing histologic examination of diminutive polyps. Endoscopy 2011; 43 (8): 683–691. doi: 10.1055/s-0030-1256381.
12. Kaminski MF, Thomas-Gibson S, Bugajski M et al. Performance measures for lower gastrointestinal endoscopy: a European Society of Gastrointestinal Endoscopy (ESGE) quality improvement initiative. United European Gastroenterol J 2017; 5 (3): 309–334. doi: 10.1177/2050640617700014.
13. Kaminski MF, Wieszczy P, Kolacz A et al. Comparison of quality measures for detection of neolasia in screening colonoscopy. Gastrointest Endosc 2016; 83 (5): AB527. doi: 10.1016/ j.gie.2016.03.1067.
14. Patel NC, Islam RS, Wu Q et al. Measurement of polypectomy rate by using administrative claims data with validation against the adenoma detection rate. Gastrointest Endosc 2013; 77 (3): 390–394.
15. Francis DL, Rodriguez-Correa DT, Buchner A et al. Application of a conversion factor to estimate the adenoma detection rate from the polyp detection rate. Gastrointest Endosc 2011; 73 (3): 493–497. doi: 10.1016/j.gie.2011.01. 005.
16. Atia MA, Patel NC, Ratuapli SK et al. Nonneoplastic polypectomy during screening colonoscopy: the impact on polyp detection rate, adenoma detection rate, and overall cost. Gastrointest Endosc 2015; 82 (2): 370–375. doi: 10.1016/j.gie.2015.01.016.
17. Boroff ES, Gurudu SR, Hentz JG et al. Polyp and adenoma detection rates in the proximal and distal colon. Am J Gastroenterol 2013; 108 (6): 993–999. doi: 10.1038/ajg.2013.68.